Data Studio Connectors for Facebook Ads & Pages Insights

You live in a data era, and understanding of your online data is key to business success.
Understanding data goes hand in hand with creating reports. A data report is a document that is organized for a better understanding of the collected data and to aid advertising and other organization goals. Data report that can easily be shared amongst colleagues is one thing that sure can help a business grow faster and more steadily.
We at Arbona know the importance of data and reports so we wanted to take a step in that direction.
We created Facebook Ads & Pages Data Studio Connectors that are free for you to use. By the end of this page, you should be able to completely understand how Facebook Ads & Pages Data Studio Connectors work and why they could help your business grow.
With that being said, let's start with basics.
What is Data Studio
Data Studio is free to use Google web product that helps visualize and share data. Data Studio can help you create informative, easy to read, easy to share, and fully customizable dashboards and reports that can help your business grow.The great thing about Data Studio is that it can easily be connected with a wide variety of sources such as Facebook and other social media platforms. Data Studio Community Connectors enable direct connections from Data Studio to a variety of internet-accessible data sources.
What are Community Connectors
Google Data Studio Community Connectors are apps developed to help gather, visualize and present data from different online databases.Whether you want to use your Facebook Ads data or just Facebook page data, Community Connectors can help you.
What is Facebook Ads by Arbona
Facebook Ads by Arbona is Data Studio Connector that helps you organize, automatize, visualize and present data “stored” at your Facebook Ads Accounts.Data can be organized into time-range-based reports (daily, weekly, monthly, ...) and compared with past date ranges.
The list of Facebook Ads data (metrics and dimensions), you can automatically organize into Data Studio report using Facebook Ads by Arbona are:
- Account name
- Adset name
- Campaign name
- Clicks (all)
- Cost per inline post engagement
- Cost per page engagement
- Cost per post engagement
- Cost video view (15s)
- CPC
- CPM
- CPP
- CTR
- Frequency
- Impressions
- Impressions
- Page Engagement
- Post Engagement
- Post reaction
- Reach
- Spend
- Unique CTR
- Unique link clicks CTR
- Unique outbound clicks
- Unique outbound clicks CTR
- Video play
- Video watched 100%
- Video watched 95%
- Video watched 75%
- Video watched 50%
- Video watched 25%
- Website CTR
What is Facebook Insights by Arbona
Facebook Insights by Arbona is Data Studio Connector that helps you automatize reporting, visualization and presenting organic Facebook Page data.Data gathered through Facebook can be organized into time-range-based reports (daily, weekly, monthly, ...) and compared with past date ranges.
The list of Facebook Pages data (metrics and dimensions), you can automatically organize into Data Studio report using Facebook Insights by Arbona are:
- Page name
- Post context
- Post date
- Post ID
- Post thumbnail
- Page likes (date)
- Post comments
- Post likes
- Post shares
- Total pages likes
How it works
Setting up Facebook Ads & Pages Data Studio Connectors is 4 step process. It shouldn't take you more than a few minutes to authorize and connect Facebook insights with Google Data Studio. You need to connect Data Studio with connectors (Facebook Ads & Facebook Insights ) just once.Step 1.
Open your Data Studio reporting Dashboard.
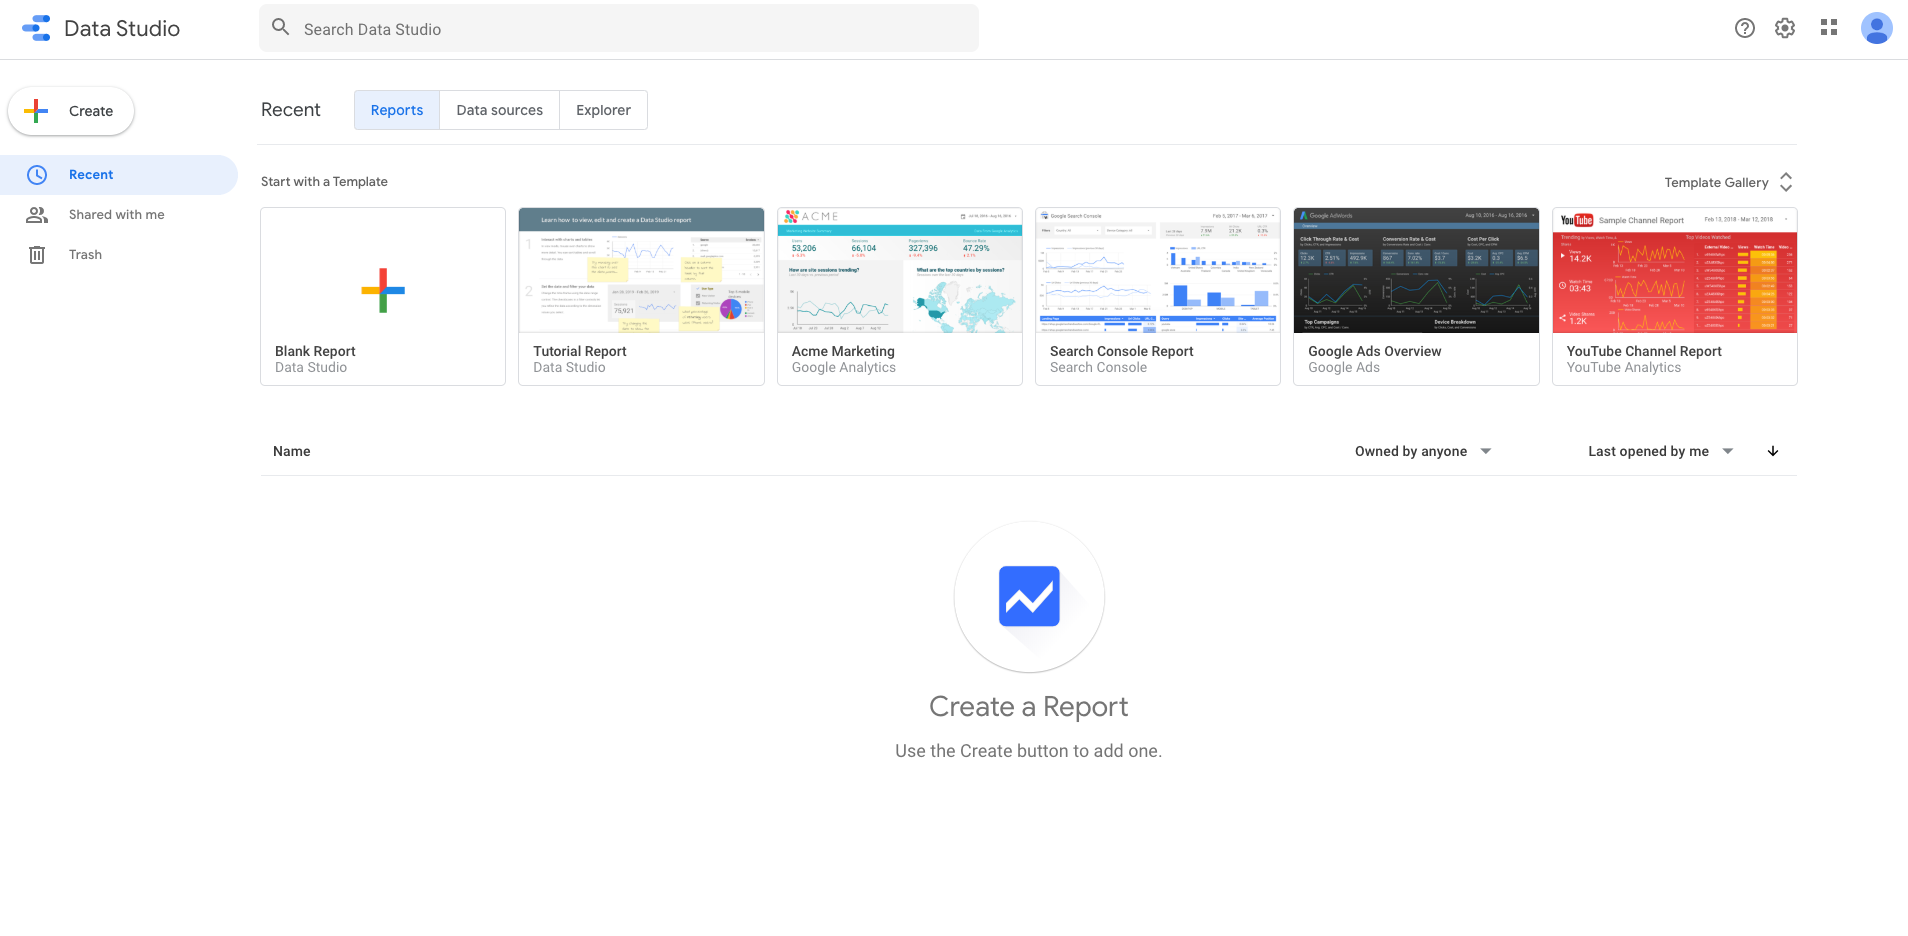
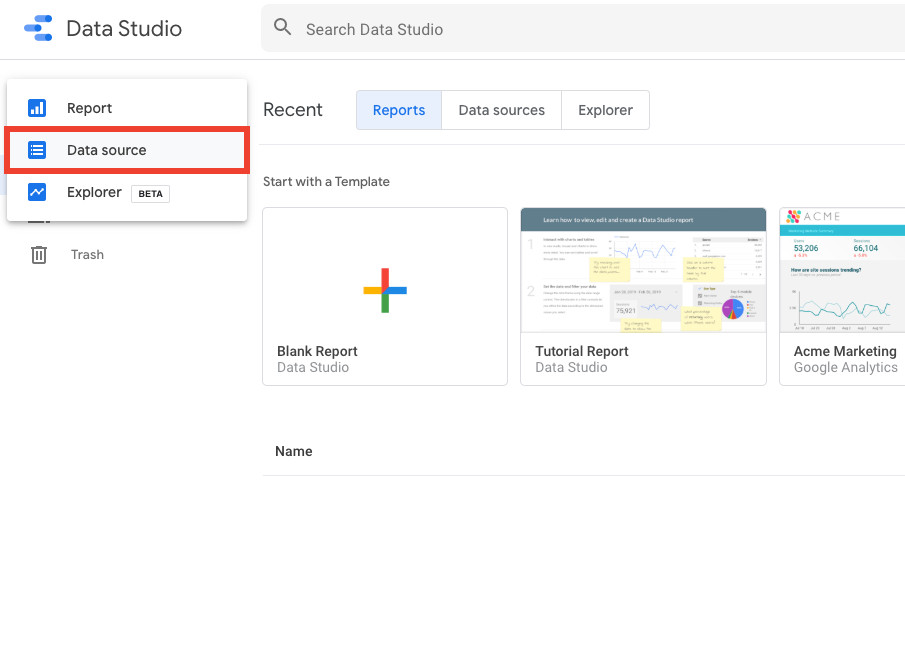
Step 2.
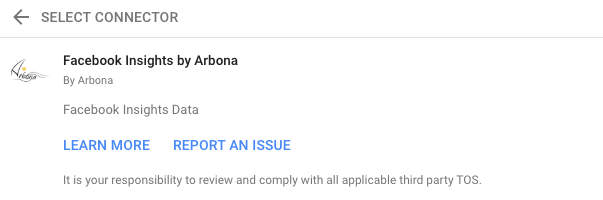
Create a new Data Source. In the search bar type ‘Facebook Insights’ or ‘Facebook Ads’. You should be able to find Data Studio Connectors created by Arbona.
Step 3.
Authorize and connect Facebook Ads Accounts and Facebook pages you want to use in your reports.
Step 4.
Drag and drop Dimensions and Metric fields, and apply filters to create automatically updated Data Studio reports.
Do you want full-scale Facebook data reports that take minutes to create?
Just click the links below and connect your Facebook data with automated Data Studio reports.